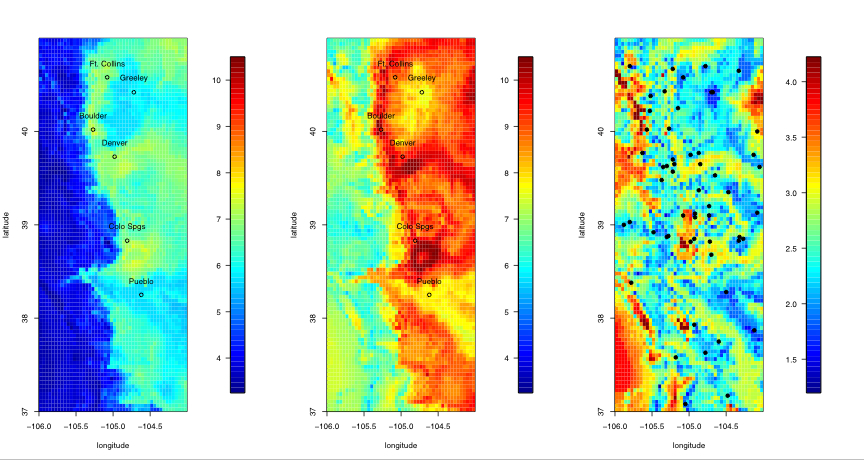
This type of diagram displays the correlation between different sets of data. This form of diagram are used as an initial analysis of a set of data. The example above shows the correlation of statistics the National Center of Atmospheric Research.
http://www.image.ucar.edu/GSP/Projects/ResearchNuggets.shtml
No comments:
Post a Comment